

There is a company in the cybersecurity space with 48,000 LinkedIn followers. Solid number. Looks healthy on paper. Their last ten posts averaged 14 likes and zero comments. Fourteen. On a page with forty-eight thousand followers.
That is not a LinkedIn presence. That is a digital ghost town with a nice sign out front.
Here is the uncomfortable truth about B2B company pages in 2026: most of them are running on fumes. High follower counts built through hiring surges, LinkedIn ads, and conference badges. Low engagement that would embarrass a local bakery's Instagram account. And nobody in the marketing org has a framework for diagnosing what is actually wrong.
That is why we built the PAGE Score.
What the PAGE Score Measures
The PAGE Score evaluates any B2B company page on LinkedIn across four dimensions. Each one captures something different about the health of your page, and each one matters for different reasons.
Performance measures how well individual posts perform relative to your follower count and industry benchmarks. The ratio matters more than the raw number. A page with 5,000 followers averaging 200 engagements per post is dramatically outperforming a page with 100,000 followers averaging 150. When we say performance, we mean: does your content punch above its weight, or does it disappear into the feed?
Activity measures posting frequency, format mix, and consistency over 30, 60, and 90 day windows. Are you showing up four to five times a week with a deliberate mix of carousels, text posts, video, and images? Or are you posting twice one week, vanishing for three weeks, then posting a product announcement nobody asked for? Consistency is the price of admission. It is not optional.
Growth measures follower trajectory, profile visit trends, and network expansion rate. Are you compounding or stagnating? Growth in 2026 is harder than it was two years ago. Pages with 100,000+ followers now see just 6.4% growth rates. Smaller pages still have room to run, but only if the content earns it.
Engagement measures comment quality, share ratio, save rate, and DM generation. This is the dimension that separates the living pages from the dead ones. Likes are participation trophies. A like takes half a second and signals almost nothing. Comments carry 15x more weight in LinkedIn's algorithm. Saves and DM shares (features LinkedIn added to analytics in late 2025) are the highest-signal actions a follower can take. When someone saves your post, they are saying: this is worth coming back to.
Together, these four dimensions give you a diagnostic score that tells you not just whether your page is working, but specifically where it is failing.
The Benchmarks You Are Actually Competing Against
Before you can score your own page, you need to know what the playing field looks like. The data from early 2026 paints a clear picture.
The median engagement rate for B2B company pages is 2.1%, up slightly from 1.8% in 2025. That is the baseline. If you are below it, your content is underperforming relative to the average B2B page, which is itself not a high bar.
Format matters enormously. Carousel and document posts pull 6.6 to 7.0% engagement, outperforming every other content type on the platform. Native documents saw a 14% year-over-year engagement increase. Video comes in next at roughly 5.1% for native uploads. Text posts and single images trail behind. If your page is publishing nothing but single-image posts with product screenshots, you are leaving engagement on the table.
Page size creates a counterintuitive dynamic. Smaller pages (1,000 to 5,000 followers) consistently achieve 4 to 8% engagement rates. Larger pages (50,000+ followers) typically hover between 1 and 3%. The reason is straightforward: smaller pages tend to have tighter, more invested audiences. Larger pages accumulate passive followers who never engage.
Here is the number that should focus your attention. The median number of monthly impressions for B2B company pages is just 3,700. That is down from 4,170 two years ago, according to Databox's benchmark group of 440 B2B organizations. Company pages now receive approximately 5% of total feed allocation on LinkedIn, while personal profiles dominate at 65%. Organic reach for company pages has dropped 60 to 66% since 2024.
The implication is clear. Your company page is fighting for an ever-shrinking slice of attention. Every post has to earn its spot.
How to Score Your Page: The Rubric
For each dimension, we use a three-tier scoring system: Strong, Average, Weak.
Performance Scoring
Strong: Engagement rate consistently above 4%. Posts regularly outperform the 2.1% industry median. Your best posts cross 8% or higher. Audience responds to your content with comments, saves, and shares, not just likes.
Average: Engagement rate between 2 and 4%. Some posts break through, but most hover near the baseline. You have occasional wins but no consistent pattern.
Weak: Engagement rate below 2%. High follower count but posts flatline. You are publishing into a void. The audience you built is not listening.
Activity Scoring
Strong: Posting four to five times per week with a deliberate format mix (carousels, text, video, images). Consistency sustained across 90+ day windows. No gaps longer than a few days.
Average: Posting two to three times per week. Some format variety, but heavy reliance on one or two formats. Occasional multi-week gaps.
Weak: Fewer than four posts per month. No format strategy. Long stretches of silence followed by bursts of activity that the algorithm does not reward.
Growth Scoring
Strong: Follower growth rate above 10% quarterly for pages under 10,000 followers, or above 3% for pages over 50,000. Profile visit trends rising. Growing without paid promotion.
Average: Growth rate between 2 and 5% quarterly. Steady but unremarkable. Not declining, not compounding.
Weak: Flat or declining follower count. Profile visits stagnating. Growth only happening during hiring surges or event seasons.
Engagement Scoring
Strong: Comments averaging 5+ per post with substantive responses (not just emoji or "Great post!"). Share ratio above 2% of total engagements. Growing save rate. DMs generated from content.
Average: Some comments, mostly from employees or known connections. Occasional shares. Saves and DMs are rare.
Weak: Engagement is almost entirely likes. Comments are sparse and shallow. Nobody is sharing or saving your content. Your posts generate zero conversations.
What Great Looks Like: The Gong Playbook
When Gong formalized their LinkedIn company page strategy, they saw results within 30 days that most B2B companies would consider unrealistic: 85% follower growth, 194% increase in likes, 108% increase in shares, and a 6,893% increase in comments. That last number is not a typo.
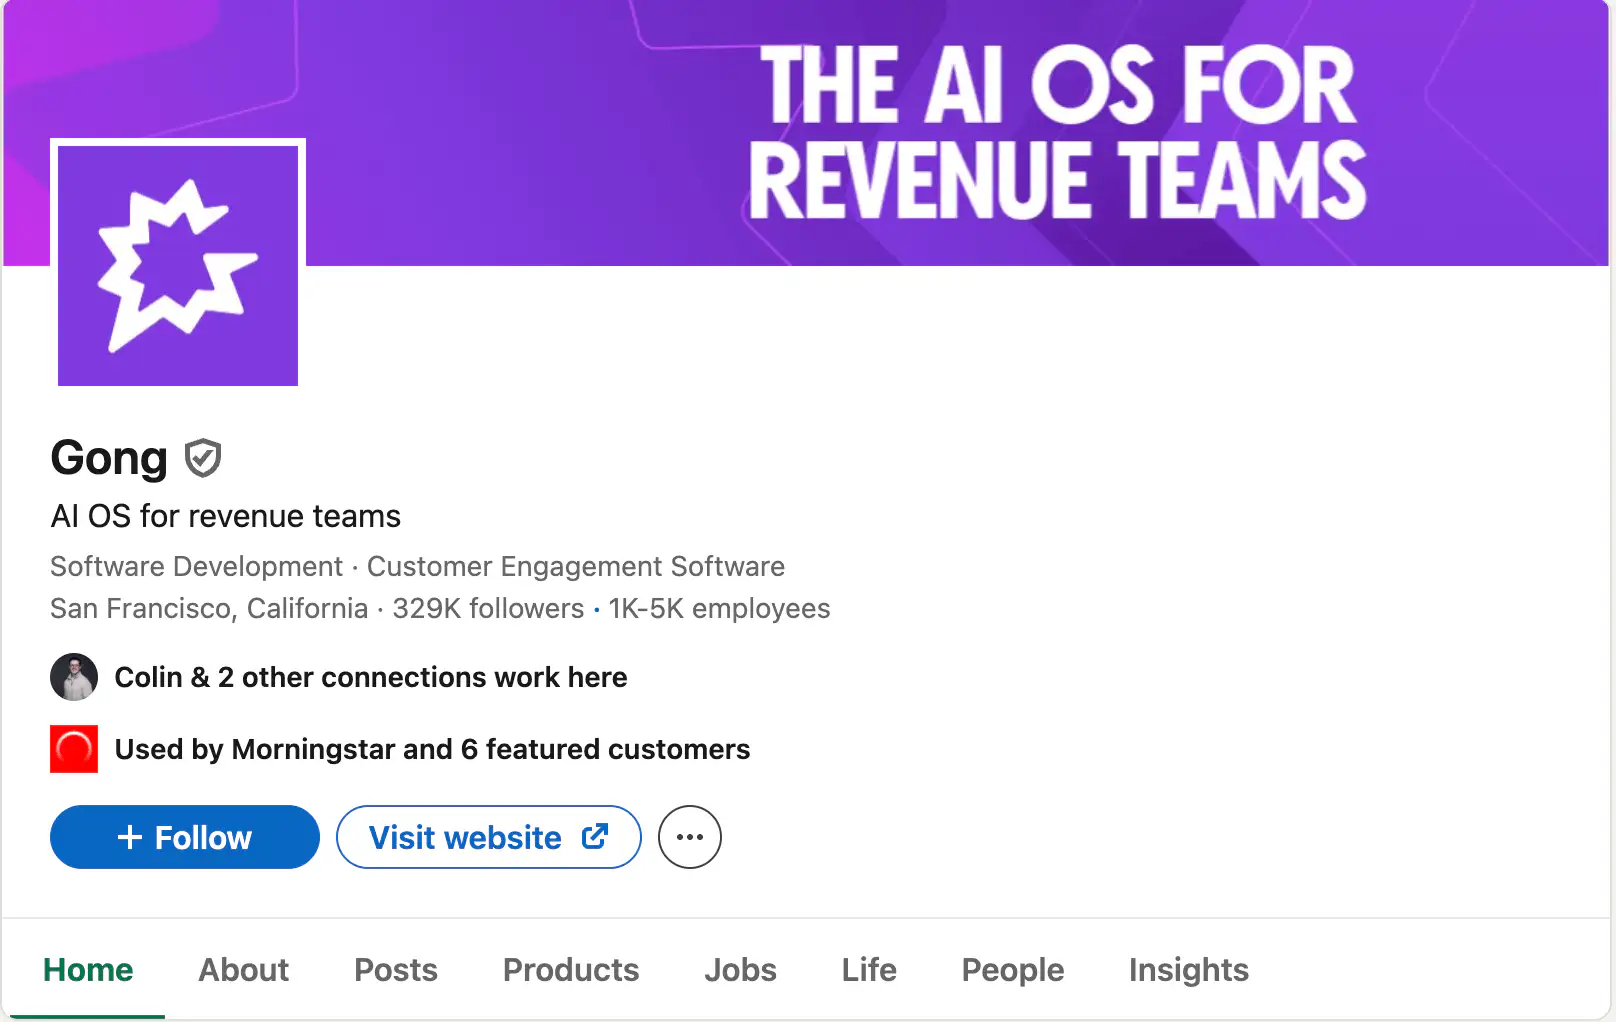
How did they do it? Three things.
First, they built a proprietary content engine around data nobody else has. Gong's platform records and analyzes sales calls, so they turned anonymized insights into shareable content. Posts like "Mention price later in your calls" and "Don't ask too many questions when talking to the C-suite" are specific, actionable, and impossible for competitors to replicate. They achieved content-market fit by turning product data into audience value.
Second, they created a company-wide visual identity on LinkedIn. The purple gradient across employee profile photos and cover images makes Gong instantly recognizable in any feed. Their stated goal: "If you take the logo out, people should still know whose post it is."
Third, they optimized every post for on-platform engagement. Short-form. High-value. No external links in the post body. This matters because LinkedIn's 2026 algorithm penalizes posts with external links by roughly 60% in initial reach. Gong understood the platform's incentives and built their content around them.
The result is a company page that scores Strong across all four PAGE dimensions. Not because they had a bigger budget, but because they had a better system.
The Most Common Pattern: High Followers, Low Engagement
In every PAGE Score audit we run, the same pattern appears. Companies have invested in follower growth (through ads, events, hiring waves, and badge scans at conferences) but never built an engagement engine. The result is a page that looks healthy on paper and is clinically dead in practice.
This is the LinkedIn equivalent of buying a mailing list. The numbers feel good. The response rate is near zero.
The fix is not to chase more followers. The fix is to earn engagement from the followers you already have. That means better content, more consistent posting, a real voice, and formats the algorithm rewards. If your PAGE Score is Weak on Engagement but Strong on Growth, you have a distribution problem. If it is Weak on Performance and Activity, you have a content problem.
Run Your Own PAGE Score Audit in 15 Minutes
Pull up your LinkedIn company page analytics. Here is the process.
Step one: export your last 30 days of posts. Calculate your average engagement rate across all posts (reactions + comments + shares divided by impressions). Compare that to the 2.1% median.
Step two: count your posts. Did you publish at least 16 times in the last 30 days (roughly four per week)? What was your format mix? How many carousels, videos, text posts, and images?
Step three: check your follower growth trend over 90 days. Is the line going up, flat, or declining?
Step four: look at comment quality. Are people saying real things, or are the comments limited to fire emojis and "Congratulations"? Are employees the only people engaging?
Step five: check saves and shares. If LinkedIn analytics shows these, note the ratio. If it does not, focus on shares and DMs as proxy signals.
If your PAGE Score is Weak in two or more dimensions, you do not have a LinkedIn presence problem. You have a credibility problem. Because in 2026, your company page is often the first thing a buyer, candidate, or partner sees when they evaluate whether you are worth their time.
What a High PAGE Score Actually Means for Your Business
This is not a vanity exercise. A high PAGE Score correlates to real business outcomes.
Buyers check your LinkedIn page before they respond to your sales team's outreach. Candidates evaluate your page before they apply. Partners assess your page before they agree to a meeting. Investors look at your page to gauge market presence and momentum.
A page with 5,000 engaged followers generates more pipeline, more inbound interest, and more talent attraction than a page with 100,000 passive followers. Engagement is the signal. Followers are just the number.
The PAGE Score gives you a language for measuring what matters. And it gives you a roadmap for fixing what does not.
This is the first in a series of company page breakdowns using the PAGE Score. Next up: how Anthropic, Gong, and Rippling each score across all four dimensions, and what you can steal from their playbooks regardless of your industry.


Joseph Abraham (Joe) is the founder of ThoughtCred and the Global AI Forum. A former CXO turned trusted advisor to CXOs, he helps enterprises evaluate and adopt AI with clarity and confidence. He champions Narrative Intelligence and enterprise-grade content, and is the architect of VEO (Vendor Evaluation Optimization), focused on how enterprises validate vendors and content, not just discover them.
.webp)

.svg)